Architecting Data Observability Across Airflow Pipelines at Scale
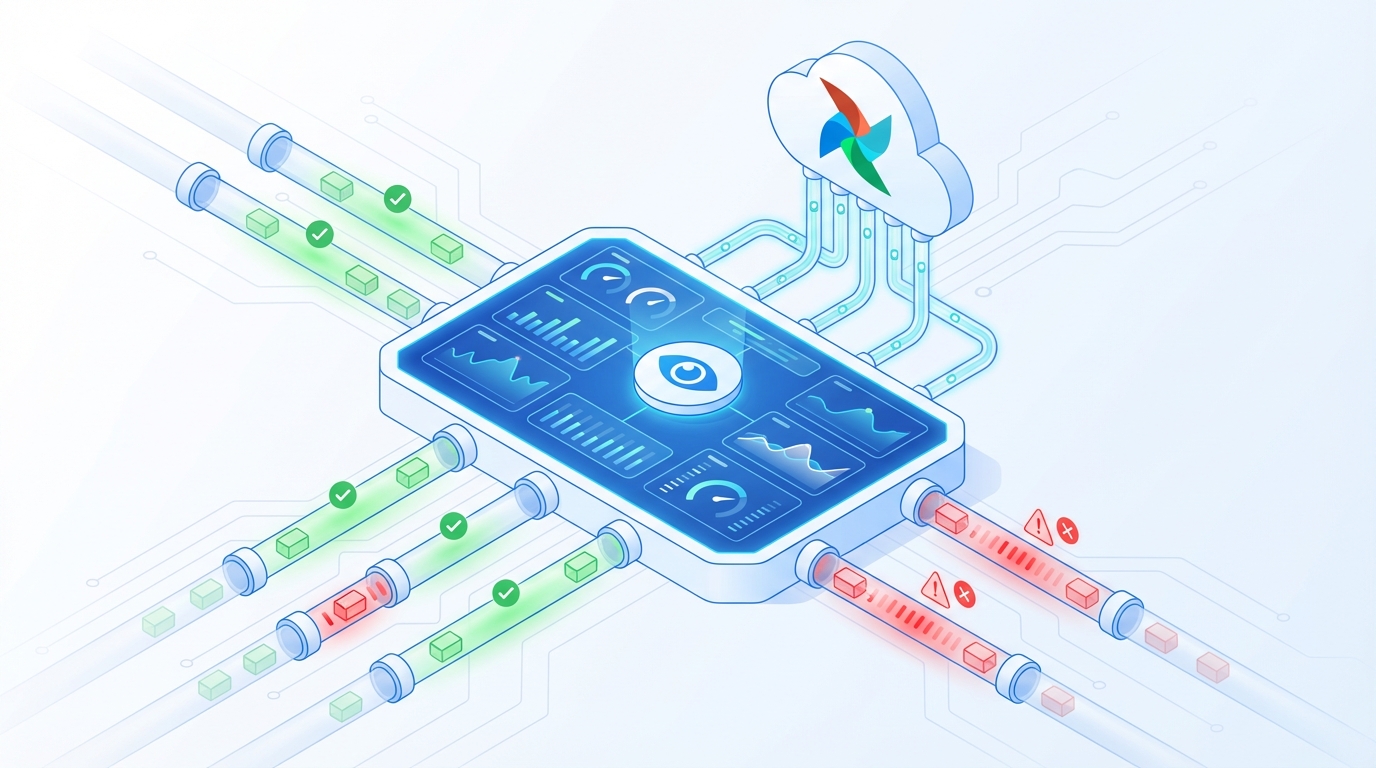
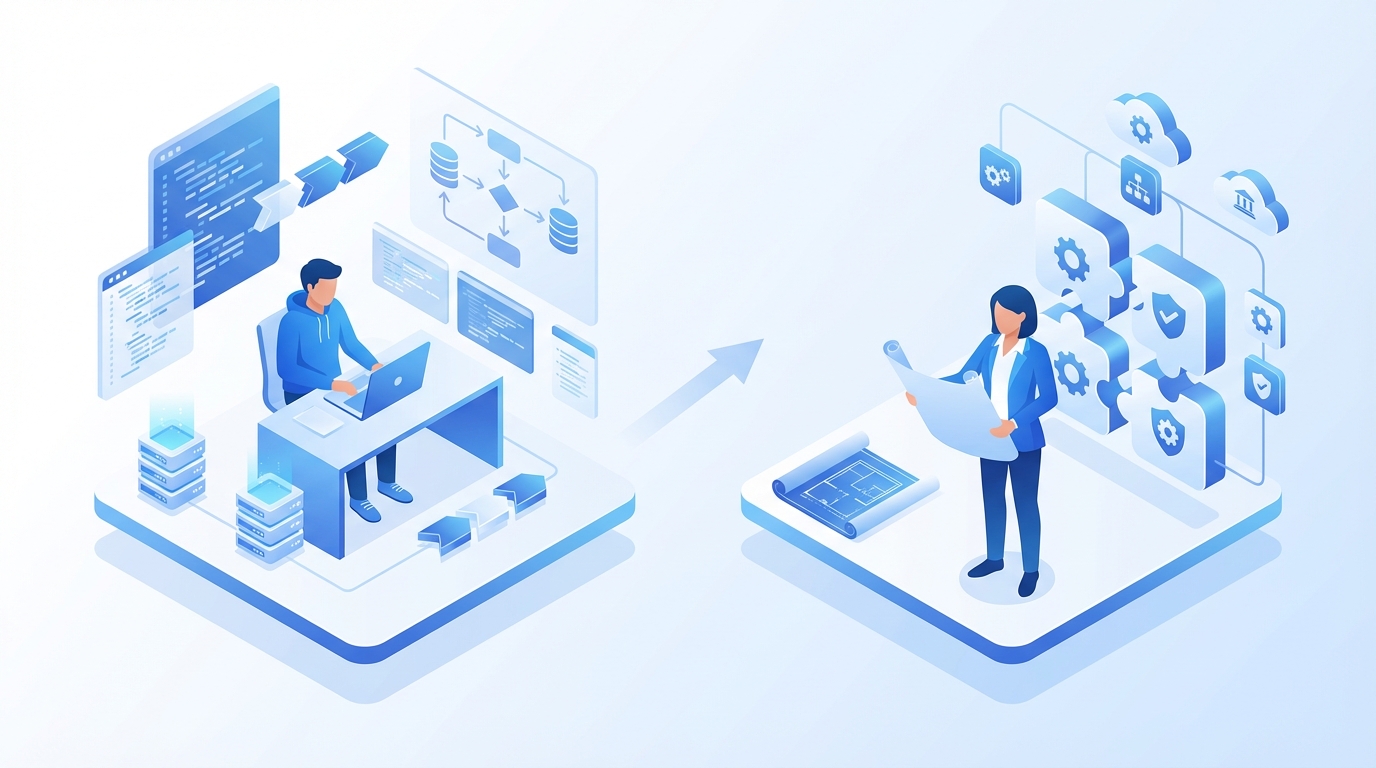
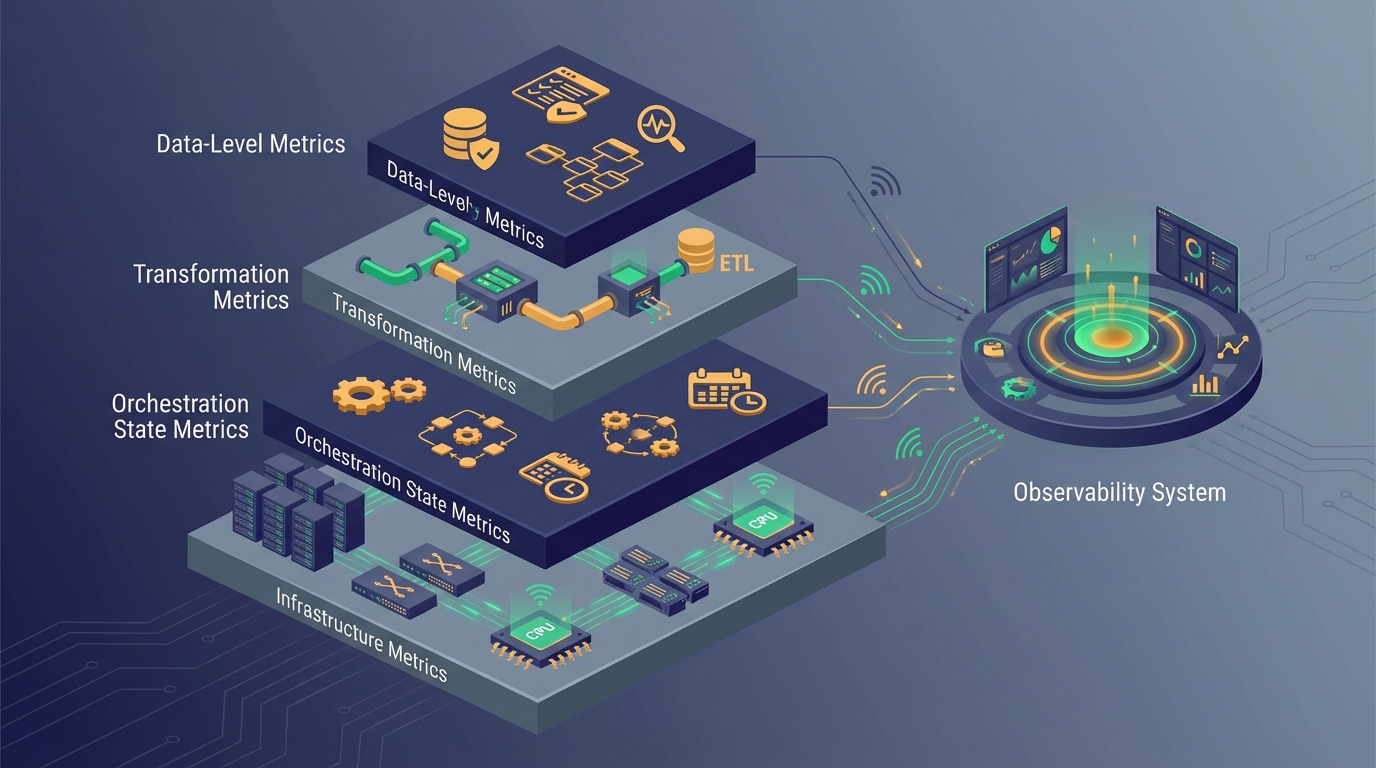
Figure: Conceptual overview of the platform.
As data platforms mature, orchestration complexity increases. Apache Airflow often becomes the control plane coordinating ingestion, transformation, validation, and downstream processes. Yet while orchestration provides structure, it does not automatically provide observability. Logging is not observability. Alerts are not observability. Dashboard widgets are not observability.
True data observability is architectural. It is the deliberate design of visibility across pipeline state, data freshness, schema evolution, performance patterns, and cross-system dependencies. In large-scale environments, observability becomes a structural necessity rather than an operational convenience.
The Difference Between Monitoring and Observability
Monitoring answers predefined questions. Observability allows you to ask new ones. Traditional monitoring focuses on task success or failure. Did the DAG run? Did the task succeed? Did the SLA miss?
Observability goes further. Why did runtime increase over the last week? Why are downstream marts receiving fewer rows? Why did schema drift occur silently without triggering failure?
Architecting observability means designing systems capable of answering unknown questions about system behavior.
Airflow as a Control Plane, Not a Monitoring Tool
Airflow provides logs, task states, retry logic, and SLA configuration. However, relying solely on Airflow UI for observability is insufficient at scale. The UI is a visualization layer, not a systemic insight engine.
At scale, orchestration must emit structured metadata. Task duration, retry counts, upstream dependency resolution, execution timestamps, and failure categories should be captured and exported to centralized observability systems.
Airflow must be treated as a signal generator rather than the final observability layer.
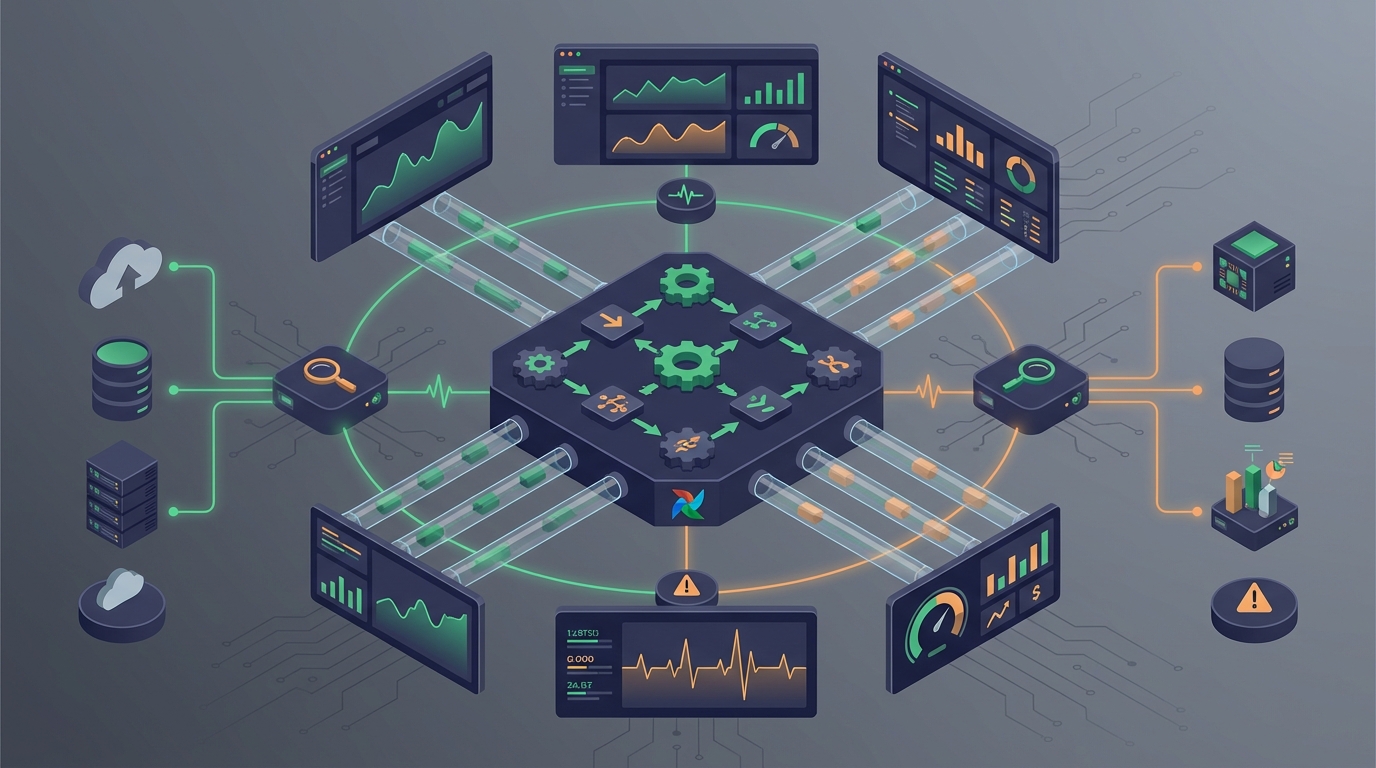
Layered Observability Architecture
Effective data observability operates across multiple layers: infrastructure metrics, orchestration state metrics, transformation metrics, and data-level metrics.
Infrastructure metrics include CPU usage, memory pressure, and container health. Orchestration metrics include task runtime variance and retry distribution. Transformation metrics include model execution time and dependency lag. Data-level metrics include row counts, freshness timestamps, and anomaly detection.
Without layering, visibility remains fragmented.
- Infrastructure metrics
- Orchestration state metrics
- Transformation metrics
- Data-level metrics
Freshness and Data Timeliness
Freshness monitoring is frequently overlooked. A pipeline may succeed technically while delivering stale data. Freshness SLAs should be defined at the dataset level rather than at the task level.
Architecturally, this requires recording ingestion timestamps, transformation completion times, and downstream publication times in structured metadata tables. These timestamps enable systemic freshness monitoring rather than reactive manual inspection.
Schema Evolution and Drift Detection
Schema drift is one of the most disruptive events in orchestrated pipelines. When upstream sources change structure, downstream models may not fail immediately. Instead, silent null propagation or incomplete joins may occur.
Observability architecture must include schema comparison mechanisms between expected and actual structures. This can be implemented through metadata versioning, automated diff checks, and alert thresholds.
Drift detection should operate independently of transformation execution to prevent hidden corruption.
Operational Metrics and Runtime Variability
Runtime trends reveal systemic stress. Gradual increases in task duration often indicate data growth or suboptimal queries. Observability should capture historical execution metrics and surface deviations.
Airflow task duration metadata can be exported to external systems for time-series analysis. When runtime variance exceeds predefined thresholds, investigation is triggered before failure occurs.
Avoiding Alert Fatigue
Excessive alerting reduces signal quality. Mature observability systems classify alerts into severity levels. Not every task retry warrants immediate notification. Alert design must reflect business impact rather than technical noise.
Escalation policies and aggregated alert patterns prevent operational overload.
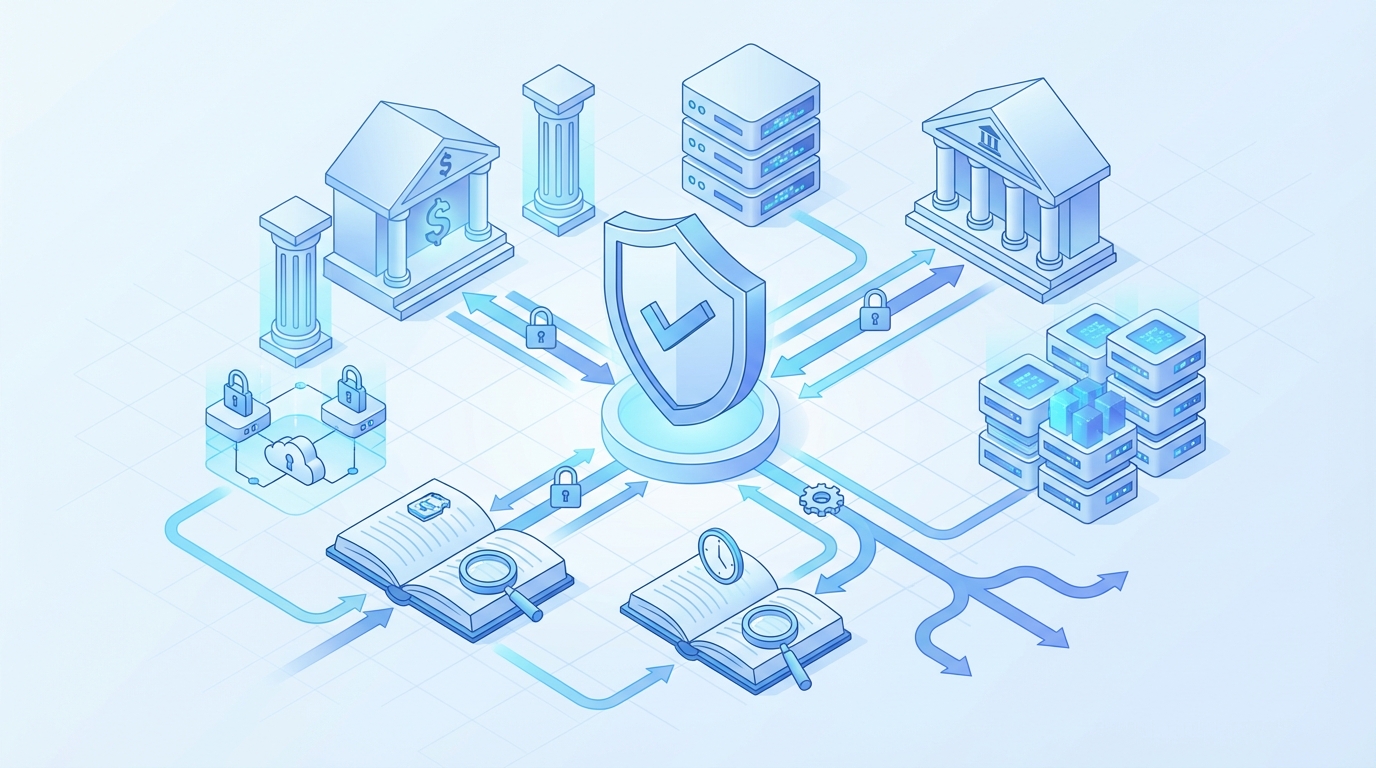
Cross-Domain Visibility
In multi-domain data platforms, pipeline dependencies often span teams. Observability must transcend team boundaries. Centralized dashboards, domain-aware metrics, and shared lineage views reduce silos.
Architectural clarity enables collaborative incident resolution.
Design Principles for Sustainable Observability
Observability must be treated as first-class infrastructure. Instrumentation should be standardized. Metadata schemas should be documented. Monitoring dashboards should reflect architectural layers rather than individual tools.
Most importantly, observability should evolve alongside platform growth. As pipelines expand, monitoring coverage must scale proportionally.
Conclusion
Airflow orchestrates pipelines. Observability sustains them. Designing a scalable data platform requires intentional visibility across ingestion, orchestration, transformation, and data layers.
Without architectural observability, complexity accumulates invisibly. With it, reliability becomes measurable and manageable.